Every other year, the Alliance for Biking and Walking releases the Benchmarking Report to collect and analyze data on bicycling and walking across all 50 states. The report is the result of original research and statistics from 20 government sources, combining to create a comprehensive data set on bicycling and walking that examines demographics, safety, funding, policies, infrastructure, education, public health indicators, and economic impacts.
The nearly 200-page report, funded by the Center for Disease Control and Prevention and authored by researchers and professionals from a variety of fields, aims to make the connection between biking and walking and healthy communities. The report is exhaustive; it not only covers statistics, but draws attentions to activists and organizations working working in the field, draws attention to the social complexity of biking and walking projects, highlights important case studies, offers analysis of the impacts of biking and walking on communities at the town, city, and state level, and provides an invaluable toolkit for anyone working in public health, city planning, or bike/ walk advocacy. For our purposes, we’ll try to narrow it down to key stats and trends, but we highly encourage you to read or at least glance over the full report if you have the time.
Biking and Walking by Demographic
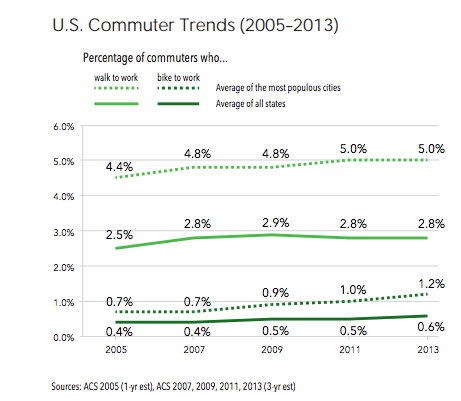
While the percentage of Americans biking to work decreased by 0.1% 1980 and 2000, it saw a slight resurgence in the early 2000s, resulting in an increased modal share for biking of 0.6% in 2013, compared to 0.4% in 2005. Those figures represent cycling’s modal share nationwide, while the modal share for cycling in the most populous cities was 1.2% in 2013. So while it may not be time to declare victory and pop the champagne bottles just yet, the data does suggest a steady positive trend toward increased biking across the US, not only in its largest cities.
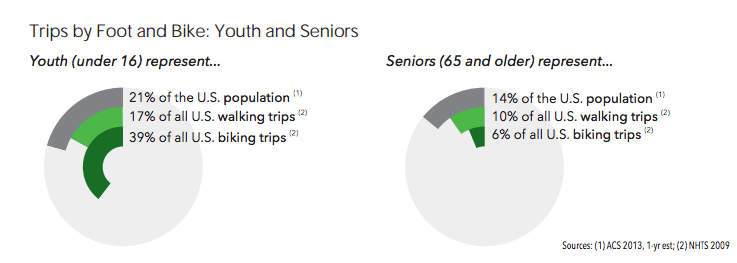
School-aged children biking to school dropped slightly between 2007 and 2009, but has since been increasing incrementally each year to land at a rate of 2.2% in 2013. However, youth under 16 account for 39% of all US biking trips, while making up only 21% of the US population, suggesting that youth use bikes more often for non-commuting purposes. Which, if any of us were to look back at our childhoods, would have been a pretty easy hypothesis.
Adults 65 and over are underrepresented in biking and walking, which the report suggests could be the fault of community design which doesn’t prioritize biking and walking. While one study cited noted that 58% of seniors would prefer to live in a walkable community, the reality is that 58% (coincidence) of American adults 60 and over live in a suburban community where walking isn’t feasible.
The survey reports a 15% decrease in car commuting between Generation X and the Millennial generation, with 92% of Gen-Xers driving to work compared to only 77% of Millennials, noting that a trend toward urbanism in the younger generation could have something to do with the shift.
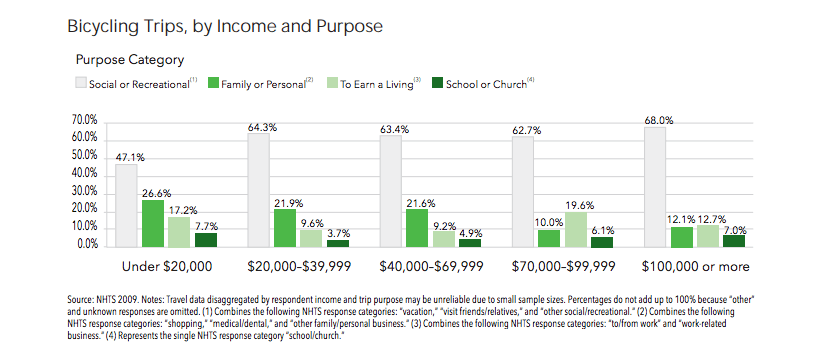
Low-income households – households with an annual income of less than $20,000 – are more likely to walk, bike, and use public and transportation than households with higher income. “Furthermore, the trips low-income households make by walking or biking are more likely to be for daily errands, work, school, or church than for social or recreational purposes,” the authors explain. Only 36% of walking trips made by low-income households were reported as social or recreational purposes, compared to 45–52% of walking trips by households of higher incomes. Similarly, only 47% of biking trips made by low-income households were reported for social or recreational purposes, compared to 63–68% of biking trips by households of higher income (NHTS 2009).
Communities of color, including those of Hispanic origin, represent up to 30% of all walking trips and 23% of all biking trips. “Considering these communities make up about 37% of the U.S. population (ACS 2013), it would seem that they are not biking and walking at rates as high as people who are non-Hispanic white,” the authors write. “However, travel data disaggregated by racial and ethnic groups are o�en unreliable due to small sample sizes. A recent report from the Safe Routes to School National Partnership, ‘At the Intersection of Active Transportation and Equity,’ provides a thorough look at the difficulty of accurately representing transportation trends by race and ethnicity (Zimmerman et al, 2015).” The report does say though, that people of color are biking and walking as their primary mode of transportation at higher rates than their distribution within the population, which suggest that they are doing so less for leisure and personal reasons.
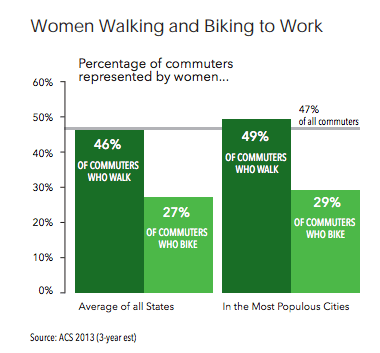
While there is no gender gap for walking – women represent 51% of the population and 51% of the walking trips – the study reports a significant gender gap for rates of cycling. Women account for only 24% of total biking trips, compared to 76% for men. For commuting, the di�fference varies slightly, as women make up only 47% of commuters, but represent 46% of commuters who walk and 27% of commuters who bike. In large cities, their percentage is slightly higher, representing 49% of commuters who walk and 29% of commuters who bike.
Health Impacts
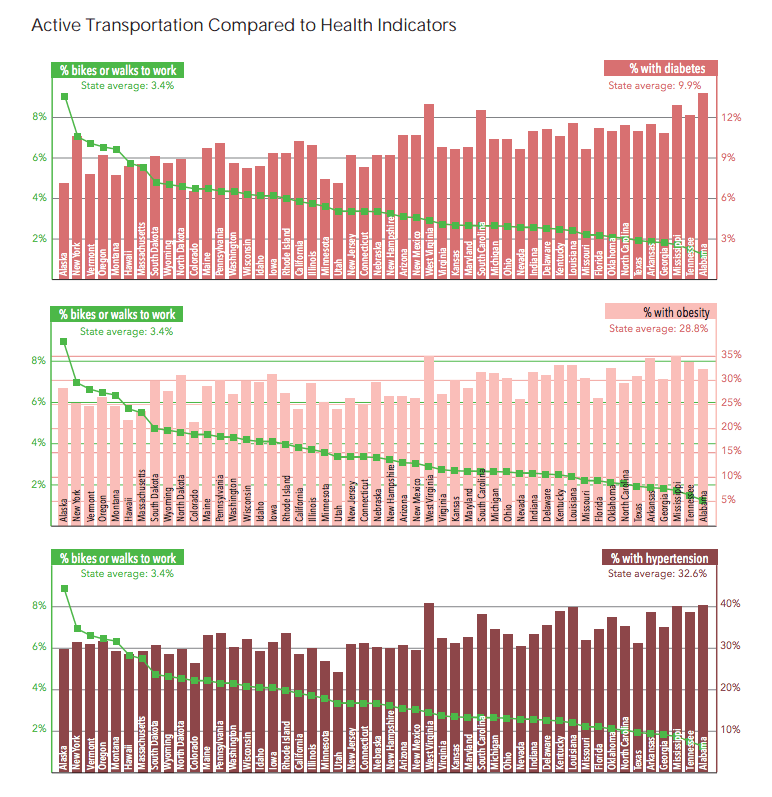
The report compares active transportation rates to health indicators nationwide, presenting a statistically compelling case to increase biking and walking to improve overall health and reduce demographic health disparities across the country. The report mentions that even moderate levels of physical activity could contribute to a reduction in many of the illnesses many Americans face, noting that physical inactivity has been linked to heart disease, certain cancers, diabetes, stroke, depression, anxiety, and osteoporosis. It posited active transportation as an inexpensive solution to the health disparity in the US, wherein low-income communities and communities of color suffer disproportionately from a wide variety of health problems.
The graphs below aren’t dramatic, but suggest a positive relationship between active transportation and a reduction in common health problems.
Biking and Walking Safety
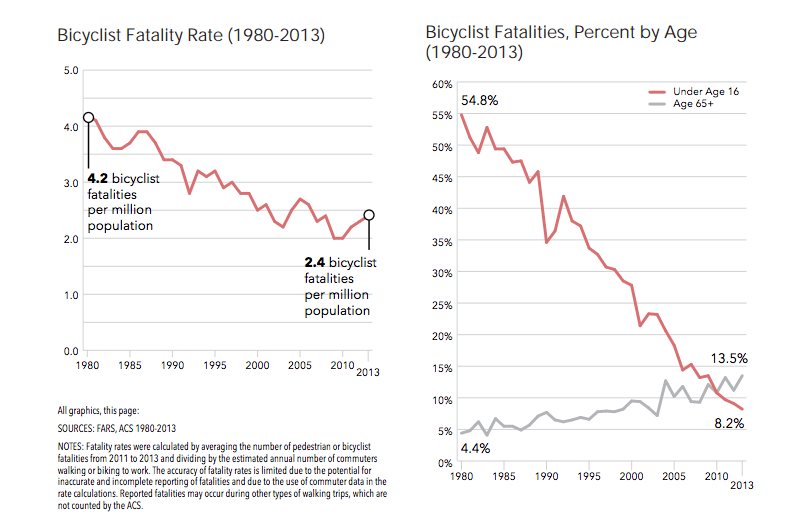
In general, there has been a downward trend of fatalities for bicyclists and pedestrians since 1980. In 1980, there were 4.2 fatalities per million population, which had been reduced to 2.4 fatalities per million in 2013. In 1980, the percent of fatality victims who were children under the age of 16 was a staggering 54.8%, which has since dropped to 8.2% in 2013. The percentage of fatality victims who were seniors, however, rose from 4.4% to 13.5% in the same time period.
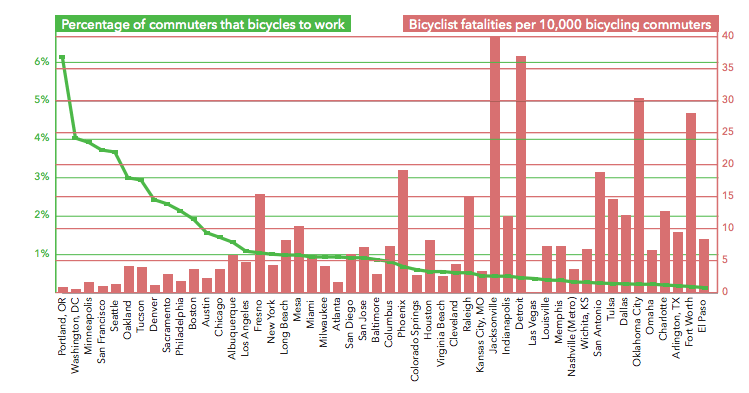
Perhaps one of the most telling charts in the report is the comparison between cycling fatalities per 10,000 population compared to the rate of commuters who bicycle to work. With only a few notable exceptions, the higher the rate of commuter cycling correlated with a lower rate of cycling fatalities. This data falls in line with the safety in numbers theory, which suggests that more bikes on the road leads to an increased awareness of cycling among drivers, creating a safer environment on the roads.
The report does make note of nationwide inequities in road safety, wherein people in low-income communities, communities of color, and rural communities are disproportionately represented among the victims of traffic injuries and fatalities. A lack of safe infrastructure, such as crosswalks, sidewalks, and bike lanes could me a major cause of this inequity.
States – Fast Facts
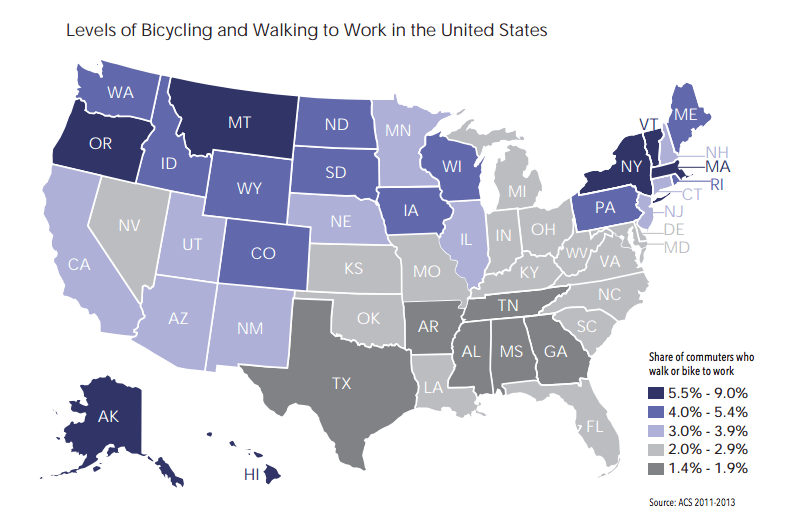
Oregon has the highest rate of bike commuting, with 2.4% of residents biking to work. The lowest is West Virginia, with a cycling mode share of only 0.1%.
Alaska has the highest rate of walking to work at 8.0%, with Alabama pulling up the rear at 1.1%.
When you add public transit into the equation, New York has the highest rate of non-car commuting at 34.5%, while Alabama again sits at the bottom with only 1.7% of state residents either biking, walking, or taking transit.
On average across all states, people of low income represent 14% of the commuter population, but are 31% of commuters who walk to work and 22% of commuters who take transit to work.
In most states, commuters of color represent a higher percentage of those who walk and use public transit than their representation within the total commuter population.
On average, women represent 47% of the commuter population, but are only 27% of commuters who bike to work.
Oregon, Colorado, and Hawaii have the highest percentage of residents meeting recommended physical activity levels, at 64%, 60%, and 60% respectively, and are also in the top ten states for both biking and walking to work.
Tennessee, Mississippi, and Arkansas have the lowest shares of people meeting the physical activity minimum, at 38%, 37%, and 41% respectively. These states also all have bicycling and walking levels below the national average.
Unfortunately, every single state saw a rise in the percent of residents who have diabetes, high blood pressure, or are obese between 2005 and 2013, and similarly every state except Minnesota and Tennessee saw a rise in the percent of residents with asthma. The states who had the smallest percent change, however, were states who have high rates of biking and walking such as Alaska, Oregon, California, and Colorado.
Forty-five states now have stated goals to increase biking and walking, and 42 states have goals to reduce bicyclist and pedestrian fatalities.
On average, states spend just 2.0% of their federal transportation dollars on bicycle and pedestrian projects (based fiscal years 2012–2014). This amounts to just $2.47 per capita for bicycling and walking each year.
California has the highest total allocation of federal funds for bike/ped projects for 2012-2014 with $288,878,497, but Alaska has the highest per-capita spending at $11.58 compared to California’s $2.53. Hawaii has the lowest total and per capita, at -$391,225 and -$0.09, respectively.
State Legislation for Biking and Walking
In the interest of “brevity,” we’ll let the chart do the talking here.
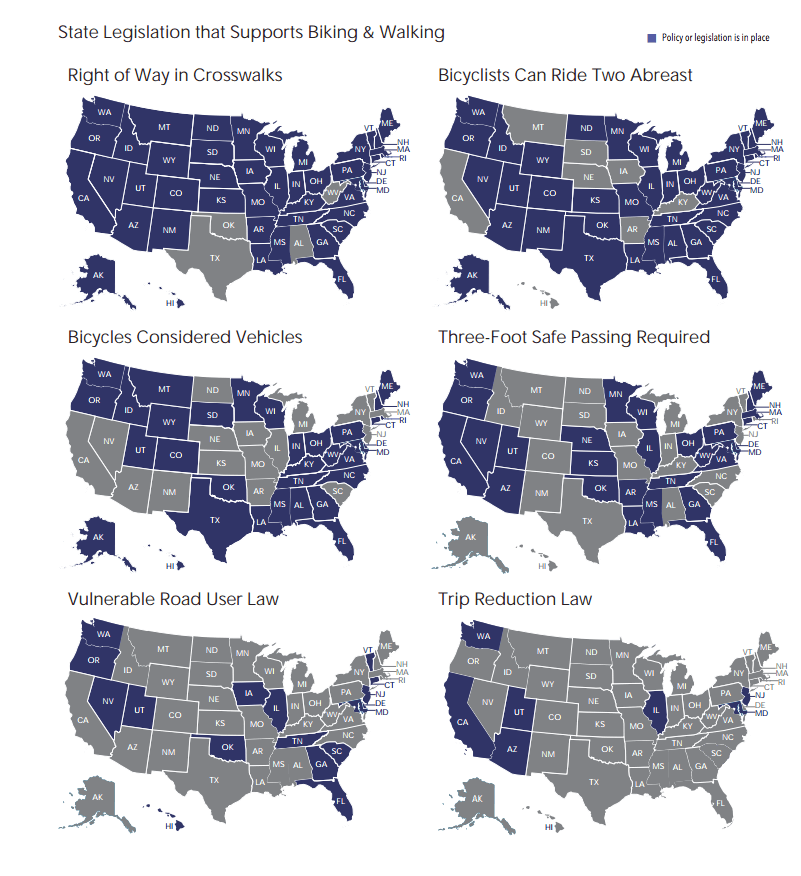
Key terms:
Bicycles Considered Vehicles: In states where bicyclists are considered vehicles, bicyclists are subject to the same traffic laws and rules as car drivers and are also granted the same rights on the road.
Bicyclists Can Ride Two-Abreast: This law allows bicyclists to ride two-abreast and commonly stipulates that the riders are not impeding the normal and reasonable movement of traffic.
Three-Foot Safe Passing Required: States with three-foot safe passing laws require vehicles overtaking a bicycle to pass at a safe distance of not less than three feet.
Vulnerable Road User Law: Vulnerable road user laws vary state-by-state and are intended to increase protection for pedestrians, bicyclists, and other non-car road users. They often increase penalties for violating existing laws that impact vulnerable road users and prohibit certain actions being taken towards them such as throwing an object or harassment.
Trip Reduction Law: As a way to manage traffic congestion and alleviate air pollution, trip reduction laws can require local, regional, or state governments or employers to encourage the use of alternative forms of transportation and develop programs that reduce drive-alone trips.
Right of Way in Crosswalks: This law requires that vehicles must stop or yield the right-of-way to pedestrians cross
The Role of Cities
“Unlike advocacy campaigns at the state level, which generally push for broad policy and funding improvements, biking and walking activities at the city level engage the public in more personal ways,” the report authors write. “Roadway fatalities are more visible at the local level. Economic impacts are felt more intensely. Bene�fits from improved infrastructure are more relevant to daily travel choices.”
Along with the above, the pace of change is also more rapid in cities. Higher density brings about the ability to impact larger groups of people with one action than in less-dense areas. The report analyzed rates of biking and walking in the US’ largest cities, compared to their walkability, population density, population change, racial demographics, poverty, and age. Overall, cities with higher density and a better Walk Score saw higher rates of biking and walking, while the other indicators were more varied in their results.
Bicycle commuting has seen steady gains in the majority of large cities from 2007-2013. Washington, D.C. and Portland, OR topped the list with a 2.3% rise in bike commuting in the aforementioned time period, followed by San Francisco with 1.5%, Seattle with 1.4% , Oakland with 1.3%, and Philadelphia with 1.1%.
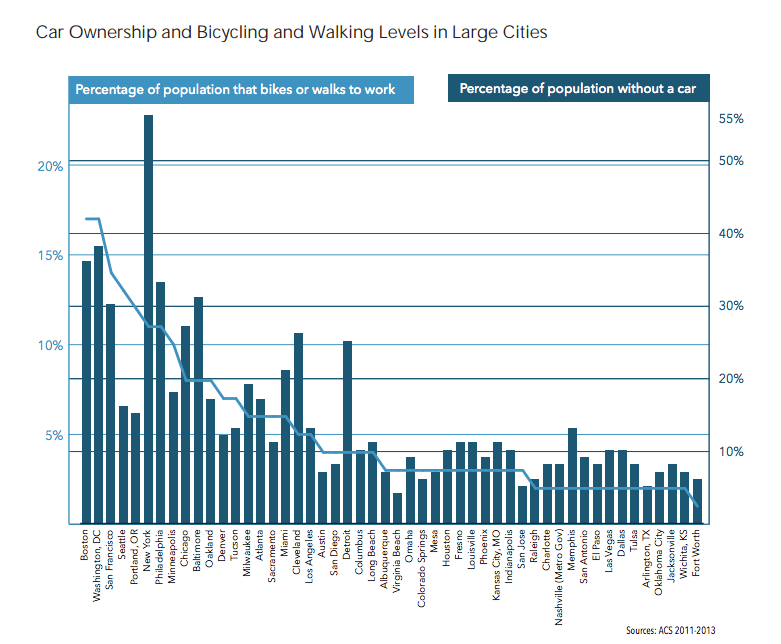
Cities with higher rates of biking and walking also have lower rates of car ownership. “Although the statistical relationship is strong,” the report notes, “The causation likely runs in both directions.” Those who don’t own a car will need to bike or walk more often, while those who bike or walk a lot by choice are less likely to want a car.
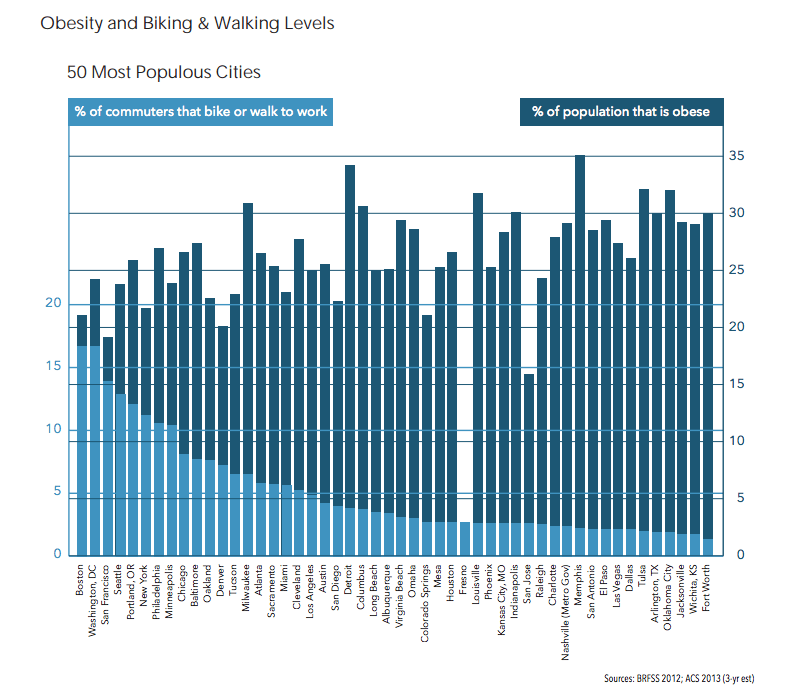
One of the most visibly striking charts is the correlation between obesity and active transportation in cities. Almost uniformly across the country’s 50 most populous cities, those with higher rates of biking and walking had lower rates of obesity. Boston and Washington DC, at the high end of the spectrum for active transportation, see very low percentages of residents who are obese. At the other end of the spectrum are Wichita, KS, and Fort Worth, TX, where few residents walk or bike but many are obese. Interestingly (and more or less unrelated but a fun fact nonetheless), Fresno, CA has a relatively low rate of active transportation but a statistically insignificant percentage of residents who are obese. Maybe it’s the juice cleanses?
The report notes that the overwhelming number of US cities of all sizes are adopting goals to increase the safety and mode share of active transportation. Of the 50 most populous cities, 23 have set out to increase biking and walking, decrease fatalities for each mode, and increase the general physical activity of residents. Among smaller cities, 10 have all seven goals. “Interestingly,” the report notes, “Many cities have adopted such goals as part of their carbon emissions reduction plan.”
Cities – Fast Facts
Washignton, DC has the lowest rate of bike and pedestrian fatalities, with 1.6 people being killed for every 10K biking/ walking commuters. Jacksonville, MS has the worst rate at 50.8 deaths per 10K commuters, followed closely by Detroit, MI with 45.3.
Thirty-one cities of varying sizes now have public bike shares. An additional 26 cities have bike shares planned.
Across the US’ 50 most populous cities, there are total of 606.0 miles of protected bike lanes and 8,648.4 miles of unprotected bike lanes.
Chicago has the most protected bike lanes, with 161 miles. Las Vegas has the most unprotected bike lanes with 460.0 miles, but only has 0.3 miles of protected lane.
Of the 50 most populous cities, 30 are now home to an Open Streets initiative, as are 14 of the smaller cities.
The End.
Okay, we did it, sort of. The Benchmarking report is an invaluable resource, and also just a fascinating set of data if you like charts, numbers, demographics, mapping, and/or bicycles. That’s all we’re going to say about it, but if you’re looking for more, you can download the full report here, and read more about the Alliance for Biking and Walking and their great work here.
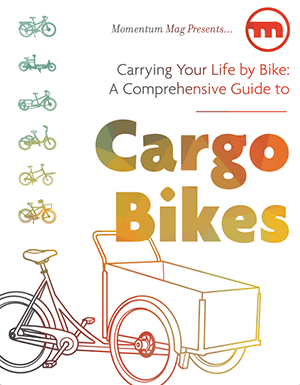
Get your FREE copy of our guide: Momentum Mag's Cargo Bike Guide
Discover the wonderful world of cargo bikes! Download this comprehensive guide to learn about different cargo bike models, brands, the history of cargo bikes, buying advice, one family's experience with cargo biking, and more.
Thank you for your submission. Please check your inbox to download the guide!


The first rule of the bicycle/walking alliance: bicycling and walking are so different that they really shouldn’t be discussed at the same time.
Thanks for posting this data, Hilary. Lots of work went into gathering it, I’m sure, and it’s much appreciated.
Comments are closed.